When you are working with a structure that is modeled with either plate or solid elements, it is quite common that you may want to look at either the printed output or contour plots of the element component stresses. If this is the case, extra care must be taken on your part to ensure that the component stresses, which you are evaluating, are output in some consistent manner.
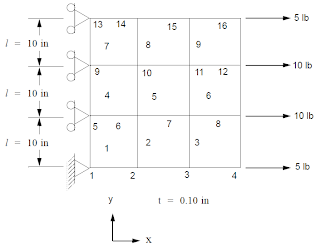
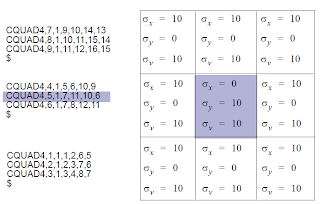
Consider a simple problem as shown in Figure 9-25. (See Install_dir/mscxxxx/doc/linstat/plate3.dat) This plate, which is 0.1 inch thick, is subjected to a uniaxial tensile load of 1 lb/in, and the boundary condition is as shown in Figure 9-25. This model is represented with a 3 x 3 mesh of CQUAD4 elements. If the elements are connected in a manner as shown in Table 9-3, then all the element sx values are in the direction of the applied loads. In this case, sx = 10 psi for all nine elements. On the other hand, if you were to change, for instance, the connectivity order for element 5 from grid points 6-7-11-10 to 7-11-10- 6, the component stresses and would be swapped. Note that this is the only difference between Table 9-3 and Table 9-4. However, if you are not aware of it and you are making a contour plot of sx, the results will be quite different for the two cases.
 |
| Figure 9-25 Uniaxial Load for a 3 x 3 Mesh |
Table 9-3 Element Component Stresses
Table 9-4 Element Component Stresses
To avoid this type of surprise, it may be easier and probably more meaningful to look at the invariant stress quantities, such as Hencky-von Mises stresses, rather than the component stresses. The grid point stress (GPSTRESS) option in MSC Nastran offers you another alternative. The grid point stress option calculates the stresses at the grid points from the adjoining plate and solid elements in a coordinate system defined by you.
This option enables you to request the output of stresses at grid points in surfaces of two-dimensional plate elements–namely, the CQUAD4, CQUADR, CQUAD8, CTRIA3, CTRIAR, and CTRIA6 elements–and in volumes containing CHEXA, CPENTA, and CTETRA solid elements.
By default, stresses are output at the center of each of these elements and also at the vertices of the CQUADR, CQUAD4 (with corner option), CQUAD8, CTRIAR, and CTRIA6 shell elements as well as the CHEXA, CPENTA, and CTETRA solid elements. This default output is not universally satisfactory because in the case concerning the surfaces of the CQUAD4 (without corner output request) and/or CTRIA3 elements, you often have a requirement for more accurate stress values at the grid points. However, the vertex stresses generated for these elements that connect to a common grid point are often not identical. These deviations are most pronounced with a crude model and converge as the model becomes more detailed. The option described in this section provides a rational method that yields reasonable and unique stresses at each vertex grid point in surfaces or volumes defined by you.
Description of the Grid Point Stress Method
A scheme to interpolate and/or extrapolate over a surface or volume from a known set of stresses (the element stresses) requires that these known stress components be transformed into a consistent coordinate system prior to averaging these stress values. This coordinate system is defined by you, and it should be generally compatible with the surface of interest in order to obtain accurate grid point stresses. Generally, such a coordinate system is the natural coordinate system that you used in the generation of the model of the surface or volume in question or the basic coordinate system. Calculated grid point stress components are output in this coordinate system, which is called the output coordinate system of the surface or volume. This coordinate system should not be confused with the output coordinate system (CD field) as defined on the grid entries.
Each stress component (e.g., sx) is treated independently of other stress components in the calculation of average grid point stress components. The stress invariants at grid points (i.e., principal stresses, the Hencky-von Mises stress, and the mean pressure) are evaluated from the average values of the stress components at grid points. The grid point stress components are output in the output coordinate system of the surface.
Two methods are used to calculate grid point stress components for plate and shell elements-namely, topological and geometric, with topological as the default method. The topological method involves the averaging of stresses at a grid point due to the contribution of the elements directly attached to this grid point. This contribution does not include the effect of the element size. On the other hand, the geometric method accounts for the element size based on the numerical technique of least squares. If the results are substantially different when using the two different methods, it may be an indication that your model is not fine enough. In general, if your model is fine enough to capture the stress gradients, the two methods should yield similar results.
A single, simplified, topological method is used to calculate grid point stress components in volumes containing solid elements. However, prior to a discussion of these methods, it is necessary to define the four categories into which grid points are divided. These definitions are important for CQUAD4 (without corner output option) and CTRIA3 elements since the stress averaging method used depends on the type of grid point. However, they have very little meaning for CQUAD8, CTRIA6, and CQUAD4 (with corner output option) since the stress averaging is performed the same way regardless of the type of grid points for elements with vertex stresses.
- Interior grid points
- Grid points that are connected only to interior line segments, i.e., line segments that are coincident with the edges of two or more elements. If the model in Figure 9-25 is used as an example, grid points 6, 7, 10, and 11 are considered as the interior grid points.
- Corner grid points
- Grid points that are only connected to a single element. For example, in the model in Figure 9-25, grid points 1, 4, 13, and 16 are considered as the corner grid points.
- Edge grid points
- Grid points that are connected to both interior and exterior line segments. An exterior line segment is coincident with the edge of only one element. For example, in the model in Figure 9-25, grid points 2, 3, 5, 8, 9, 12, 14, and 15 are considered as the edge grid points.
- Exception grid points
- Grid points at which discontinuities in stress can occur. Exception grid points are discussed later in this chapter.
Stresses at interior, corner, or edge grid points are considered to be continuous between directly connected elements. Stresses at exception points may be discontinuous between connected elements and, as will be seen, a different grid point stress may be output for each of the connected elements. Engineering judgment must be exercised in assessing the validity of grid point stresses at exception points. Note that the classification of the grid point types is performed automatically by MSC Nastran based on their connectivities.
Topological Method – Plate Elements and Solid Elements
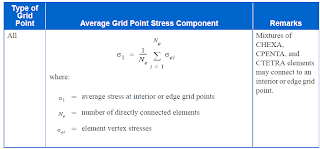
The topological method for the evaluation of grid point stresses only recognizes the existence of interior, edge, and corner points, i.e., exception points are not considered as a distinct category of grid points (exception grid points arise as a result of geometrical rather than topological characteristics). The relations used to compute the average grid point stresses in the surfaces of the plate elements by the topological method are described in Table 9-6. The relations used to compute the average grid point stresses in the volumes containing solid elements are described in Table 9-6. The topological method is the default method.
Table 9-5 Evaluation of the Average Grid Point Stresses for Plate and Shell Elements by the Topological Method
In the geometric method, grid point stresses for points that connect to CQUAD8, CTRIA6, and/or CQUAD4 (with corner output request) elements use the average of the element corner stresses. If CQUAD4 (without corner output request) or CTRIA3 elements connect to these points, their influence is not considered. The geometric method for the determination of average grid point stresses that connect only to CQUAD4/CTRIA3 elements utilizes the numerical technique of least squares.
Treatment of Exception Points
Exception points are defined as grid points at which stress discontinuities may occur. Such discontinuities may occur due to a substantial difference in slope between adjacent elements directly connected to the same line segment or if more than two elements are directly connected to the same line segment. Figure 9-26 is an example of such a situation. Grid points 1, 2, 3, 4, and 5 are examples of exception grid points.
 |
| Figure 9-26 Adjacent Elements with Different Slopes Connected to the Same Line |
Note that this situation is geometric rather than topological in nature and is, therefore, only considered under the geometric interpolation option.
Since exception points are defined as grid points at which stress discontinuities may exist, it is conceivable that a computed average grid point stress at an exception point may be different for each of the directly connected elements. However, it is more common to find that a subset of the elements, which are directly connected to an exception point, forms a subsurface on which stresses may be considered to be continuous. A unique average grid point stress may then be computed for the elements of the subsurface. For the problem shown in Figure 9-18, you may consider creating two subsurfaces-one subsurface consisting of elements within the shaded surface and another subsurface consisting of elements within the unshaded surface.
The calculation of average grid point stresses for a subsurface that contains two or more elements is performed when the geometric interpolation method is used for edge points. If a subsurface consists of a single element, the calculation of an average grid point stress is performed in the same manner as utilized in the calculation of average grid point stresses at corner points. It must be noted, however, that sD , sE 1 , and sE 2 may be interior, exterior, or corner points (see Table 9-6).
As stated previously, each element stress component (independently of all other stress components) is transformed into the output coordinate system before averaging. It is necessary that this output coordinate system vary slowly over the surface in order for the interpolated stresses to be accurate. This approach is certainly valid for stress interpolation over elements that are in a common plane, and it should be adequate for engineering analysis when the difference in slope between adjacent elements is small. If this slope is not small, it is suggested that you break them into multiple surfaces or volumes. When the elements do vary substantially from a smooth surface, you must utilize engineering judgment relative to the accuracy of the resultant stress data.
Average grid point stresses are only computed at element vertices. For elements with mid-edge grid points, you can estimate the stresses at these mid-edge grid points to be the average of the computed stresses at the grid point at the ends of the edge in question.
Grid Point Stress Interface
A sample of the grid point stress data recovery option is shown in this section.
Case Control Section
The following Case Control commands are used by the grid point stresses:
GPSTRESS Requests grid point stresses output.
STRFIELD Requests grid point stresses for graphical postprocessing and stress discontinuities.
STRESS Requests element stress output.
or ELSTRESS
OUTPUT(POST) Delimiter.
SET Defines a set of elements that define a surface or volume.
SURFACE Defines a surface of plate elements referenced by the SET command.
VOLUME Defines a volume of solid elements referenced by the SET command.
In static analysis, place the GPSTRESS command above the subcase level or in individual subcases. If the GPSTRESS command is above the subcase level, it is utilized by all subcases and subcoms unless overridden by a GPSTRESS command in a subcase or subcom.
Note that if grid point stress data is desired, an ELSTRESS (or STRESS) request for all elements in the surfaces or volumes of interest must be included in the Case Control Section. This request is in addition to the GPSTRESS request. Such requests cause the output of element stress data as well as grid point stress data. If the printed output of element stress data is not desired, the requests “ELSTRESS(PLOT) = x” or “STRESS(PLOT) = x” may be used. In the model shown in Figure 9-25, if grid point stresses are requested for grid point 11, then element stresses must be requested for a set that includes at least elements 5, 6, 8, and 9. Furthermore, the set of elements in the SURFACE definition must also include elements 5, 6, 8, and 9. In this example, if one of the elements that is connected to grid point 11 (e.g., element 6) is left out in the SET definition, then User Warning Message 4621 is issued. The GPSTRESS values calculated in this case may be meaningless.
The OUTPUT(POST) section of the Case Control Section contains specific requests for grid point stress data for the surfaces or volumes of elements. Any number of element surfaces or volumes may be defined, but only those surfaces or volumes referenced through the GPSTRESS command will have grid point stress data generated and output.
Bulk Data Section
If postprocessing of grid point stress is desired, the parameter PARAM,POST,x is needed in the Bulk Data Section. There is no other special requirement.
Again, the model in Figure 9-25 is used for this illustration. In this case, you may want to have two separate surfaces. The first surface contains elements 1, 2, 4, 5, 7, and 8; the second surface contains all elements. Part of the input file is shown. (See Install_dir/mscxxxx//doc/linstat/gpstress.dat)
In the above example, surface 100 contains elements 1, 2, 4, 5, 7, and 8 that were referenced by set 1. Surface 200 contains all of the elements that were referenced by set 2. The element positive normal is in the direction of the z-axis of the basic coordinate system. By default, the grid point stresses are transformed to the basic coordinate system. The grid point stresses are called out by the GPSTRESS command, which points to set 10, which, in turn, points to surfaces 100 and 200. Element stresses are requested for all of the elements, which, of course, encompass elements 1, 2, 4, 5, 7, and 8. The STRFIELD command is required to generate postprocessing data for your graphic package. A partial output of a typical grid point stress is provided below.
All of the content in this blog post has been directly extracted from Chapter 9 of the MSC Nastran 2012 Linear Static Analysis User's Guide.


Leave A Reply