Topic: To conclude the last few posts on using FEA to analyze composites, I leave off with this example from Use of Finite Element Analysis to Create Robust Composite Designs – Going Beyond First Ply Failure.
PRACTICAL EXAMPLE OF FAILURE ANALYSIS COMPARED WITH TEST RESULTS
This work is an overview of some collaborative work performed with DLR, Braunschweig. The background to this testing is that corner L-brackets have some specific failure modes related to the “unfolding” of the bracket causing large out-of-plane stresses. The testing investigates different thicknesses and layups. Initially simple 4 point bending tests were performed on samples (Figure 9). These have the advantage that the out-of-plane stresses are not high so can provide a baseline set of test results which don’t include the unfolding effect. These tests were followed up by tests on the L sections. (Figure 10)
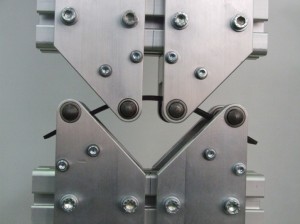
Figure 9. Four-point bending test
Figure 10 L Bracket test setup
Theoretical basis for stresses in radius
The theoretical solution to this problem is presented by SG Lekhnitskii [4]. From this we can see typical radial stress variations (figure 11) and tangential stress variations (figure 12). We can use this to help interpret some of the test results. As can be seen from the curve on figure 9 the radial stresses are at their maximum typically 1/3 of the thickness from the inner radius. Very approximately we can say cracks in this area are likely to be from unfolding.
Figure 11 out-of-plane stresses in radius area
Figure 12 Tangential stresses in radius area
Observations during test
Testing is more than just load-deflection graphs. During the testing observations can be made which can aid interpretation of the results. For example during some of the straight 4 point bend tests cracking noises were heard at load levels which were still within the expected safe loads. The specimens were lightly covered in dust and it was possible to see from the “puffs” of this dust that the cracks were on the tension side of the specimen. With these particular specimens further loading resulted in delamination due to inter-laminar shear. This delamination then allowed a section to buckle which then resulted in fibre rupture to complete the failure. So this specimen showed 4 individual failure mechanisms.
- Resin cracking
- Delamination
- Buckling
- Compressive fibre failure
Our analysis needs to deal with these situations.
Material Test Results
Initially materials tests were performed according to EN standards including EN6031 for shear. The problem with this test method is that it gives shear strengths but not the stress/strain behaviour for the resin. To overcome this tests were performed using ASTM D5379 (Iosipescu) which gives you the shear stress/strain curve. Figure 13 shows normalised results for unidirectional and fabric tests. The EN standard tests would give the peak values of strength which are significantly beyond the linear limit of the material.. (By a factor of more than 2) This can have a significant effect on the failure analysis and may indicate that you may have resin failure earlier than predicted.
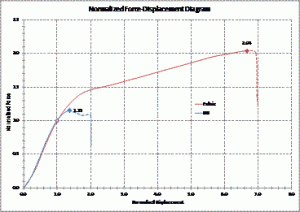
Figure 13 In-plane shear test results
L Section Test results
Figures 14 and 15 show typical failures of the L angles in interlaminar shear and out-of-plane delamination (AKA “unfolding”)
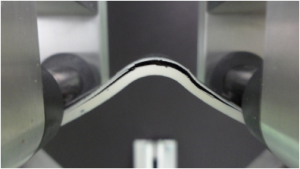
Figure 14. Example of Interlaminar Shear Failure
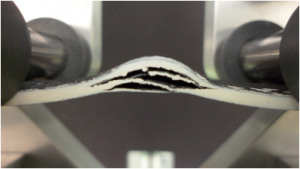
Figure 15. Example of “unfolding” failure
The interesting question here is why do some layups fail as a shear and some as an unfolding? Looking at the results we can see a tendency to fail in shear where we have 0 and 90 plies together as this increases inter-laminar stresses. Almost all specimens with 0/90 together fail due to interlaminar shear. This reinforces the rule that designs should avoid 0/90 together. In this scenario maybe we should use cloth? The weave of the cloth would prevent delaminations in the 0/90 interface.
Figure 16 shows a set of test results combined with an analysis where failure is not included. As you can see the finite element model stiffness is accurate in the initial unfailed part of the curve. What you can also see is the degree of scatter in the test results. Also after the failure the structure will continue to take load. This is how we can almost flatten the specimen in figure 16.
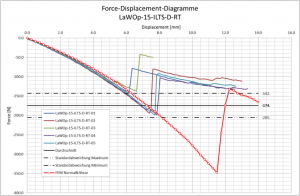
Figure 16. Load deflection curves for test and analysis
If we now add a breaking glued contact model to the analysis we get behaviour as shown in Figure 17. Here you can see the delaminations in the corner.
Figure 17. Deformed model showing delaminations
Figure 18 shows an example of this analysis compared with test. The analysis (red curve) is correlating very well with the typical test behaviour. In this case we have an interlaminar shear failure.
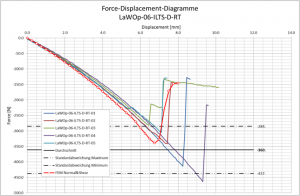
Figure 18. Correlation of results for an interlaminar shear failure
Not all results correlate so closely with this basic approach. Figure 19 shows a correlation plot with unfolding behaviour. In this example the analysis overpredicts the strength. The reason for this is probably due to the non-linear behaviour of the resin.
Figure 19. Correlation of results for an unfolding failure.
Next steps
The analysis of these failures is continuing using a combination of non-linear resin properties and VCCT. This may also be combined with progressive failure and cohesive zone modelling. We anticipate that this analysis will improve the correlation and allow us to get a better understanding of what is needed in modelling methods to get closer to reality in the simplest way. Once the L bracket correlation is complete DLR will be looking at a T stiffener to increase the complexity and verify the methodology still gives good results.


Want to expand your knowledge?
- Watch a YouTube playlist on Composite Material Analysis.
- Watch a YouTube webinar titled Failure Analysis of Composite Structures.
- Watch a YouTube webinar titled Progressive Ply Failure Analysis of Advanced Composites.
- Watch a YouTube webinar titled Modeling Composites with MSC Nastran.


Leave A Reply